Understanding Cloud Architecture Diagrams: A Guide to Visualizing and Communicating Cloud Infrastructures
Cloud architecture diagrams are essential tools for understanding, designing, and communicating cloud-based systems. They provide a visual representation of the components, relationships, and interactions within a cloud environment, making it easier for stakeholders to comprehend the system’s architecture and make informed decisions.
Define Cloud Architecture Diagrams
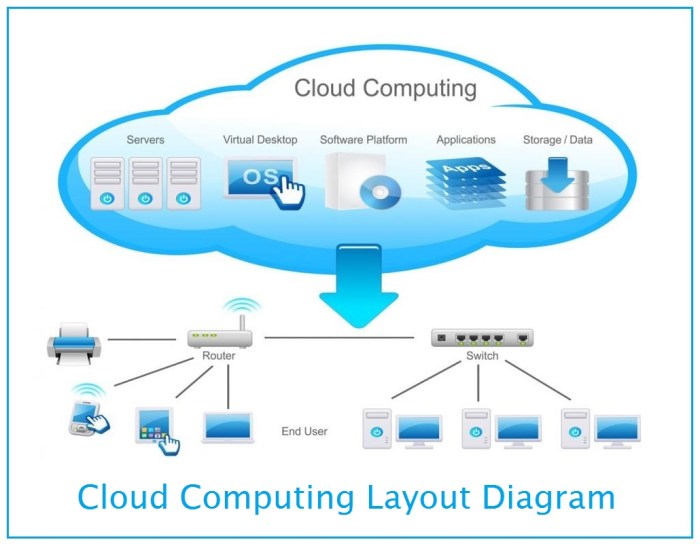
Cloud architecture diagrams are visual representations of the components, relationships, and interactions within a cloud computing environment. They provide a comprehensive overview of the cloud architecture, making it easier to understand and manage the system.
These diagrams typically include elements such as:
- Cloud services (e.g., compute, storage, networking)
- Virtual machines and containers
- Databases and other data sources
- Load balancers and firewalls
- Network topology and connectivity
Cloud architecture diagrams are essential for planning, designing, and managing cloud computing environments. They help stakeholders understand the system’s capabilities and limitations, identify potential bottlenecks and vulnerabilities, and make informed decisions about resource allocation and optimization.
Types of Cloud Architecture Diagrams

Cloud architecture diagrams can be classified into various types, each serving a specific purpose and providing a different perspective on the cloud infrastructure. The primary types include logical, physical, and deployment diagrams.
Logical Diagrams
Logical diagrams depict the high-level architecture of a cloud system, focusing on the functional components and their relationships. They provide a conceptual view of the system, without delving into the physical infrastructure or implementation details. Logical diagrams are useful for understanding the overall design and flow of data and processes within the cloud environment.
Physical Diagrams
Physical diagrams illustrate the physical infrastructure that supports the cloud system. They show the physical components, such as servers, networks, and storage devices, and how they are interconnected. Physical diagrams provide a detailed view of the hardware and infrastructure that underpin the cloud services.
They are helpful for understanding the physical constraints and limitations of the system.
Deployment Diagrams
Deployment diagrams depict the actual deployment of cloud resources and services. They show how the cloud components are configured and interconnected to provide the desired functionality. Deployment diagrams are useful for understanding the specific implementation details and configurations of the cloud system, including the distribution of resources across different cloud regions and zones.
Benefits of Using Cloud Architecture Diagrams

Cloud architecture diagrams offer numerous advantages to stakeholders, fostering improved communication, collaboration, and decision-making.
These diagrams serve as a shared language, enabling stakeholders from various backgrounds to understand complex cloud environments. They provide a visual representation that simplifies technical concepts, making them accessible to both technical and non-technical audiences.
Enhanced Communication
- Promote clear and concise communication by providing a visual reference for discussions and presentations.
- Eliminate misunderstandings and misinterpretations by establishing a common understanding of cloud architecture.
Improved Collaboration
- Facilitate collaboration among teams by allowing stakeholders to share and review architecture diagrams.
- Enable cross-functional discussions and feedback, leading to more informed decisions.
Optimized Decision-Making
- Provide a holistic view of cloud architecture, allowing stakeholders to assess potential risks and benefits.
- Support informed decision-making by enabling stakeholders to evaluate different cloud deployment options and their impact on business goals.
Key Elements of Cloud Architecture Diagrams

Cloud architecture diagrams are visual representations of the components and relationships within a cloud computing environment. They help stakeholders understand the architecture, identify potential risks and opportunities, and make informed decisions about cloud adoption and management. Key elements commonly found in cloud architecture diagrams include cloud providers, services, and infrastructure.
Cloud Providers
Cloud providers are the companies that offer cloud computing services. They provide the infrastructure, platforms, and software that enable businesses to build and run their applications in the cloud. Examples of cloud providers include Amazon Web Services (AWS), Microsoft Azure, and Google Cloud Platform (GCP).
Services
Cloud services are the building blocks of cloud computing. They provide a wide range of functionality, from compute and storage to networking and security. Examples of cloud services include virtual machines (VMs), databases, and content delivery networks (CDNs).
Infrastructure
Cloud infrastructure is the physical and virtual resources that support cloud services. It includes servers, storage devices, and network equipment. Cloud infrastructure is typically managed by the cloud provider and is not visible to the customer.
Designing Effective Cloud Architecture Diagrams
Designing effective cloud architecture diagrams is crucial for clear communication and stakeholder understanding. Here are some best practices to follow:
Clarity and Accuracy
* Use consistent symbols and notations throughout the diagram to avoid confusion.
- Label all components and connections clearly to ensure easy identification.
- Ensure the diagram is up-to-date and reflects the latest architecture.
Stakeholder Understanding
* Consider the audience’s technical expertise and tailor the diagram accordingly.
- Use simple language and avoid technical jargon to enhance comprehension.
- Provide a legend or glossary to explain any unfamiliar terms or symbols.
Additional Tips
* Use colors and shapes to differentiate between different components and relationships.
- Group related components together to improve readability.
- Use arrows or flowcharts to illustrate the flow of data or processes.
- Keep the diagram visually appealing and easy to navigate.
By following these best practices, you can create effective cloud architecture diagrams that facilitate clear communication and stakeholder understanding.
Tools for Creating Cloud Architecture Diagrams
Creating cloud architecture diagrams can be a complex task, but there are a number of tools available to help you get the job done. These tools can provide you with a variety of features to help you create clear and concise diagrams that will help you communicate your cloud architecture plans to stakeholders.
Some of the most popular tools for creating cloud architecture diagrams include:
- Lucidchartis a web-based diagramming tool that offers a wide range of features for creating cloud architecture diagrams. Lucidchart includes a library of pre-built templates and shapes that you can use to create your diagrams, and it also allows you to import your own images and documents.
- Visiois a desktop-based diagramming tool that is part of the Microsoft Office suite. Visio offers a wide range of features for creating cloud architecture diagrams, including the ability to create custom shapes and connectors. Visio also includes a library of pre-built templates and shapes that you can use to create your diagrams.
- Draw.iois a free, web-based diagramming tool that offers a wide range of features for creating cloud architecture diagrams. Draw.io includes a library of pre-built templates and shapes that you can use to create your diagrams, and it also allows you to import your own images and documents.
- PlantUMLis a text-based diagramming tool that can be used to create cloud architecture diagrams. PlantUML is a free and open-source tool, and it is available for a variety of platforms.
Each of these tools has its own advantages and disadvantages. Lucidchart is a good choice for teams that need to collaborate on diagrams, while Visio is a good choice for users who need to create complex diagrams. Draw.io is a good choice for users who need a free and open-source tool, while PlantUML is a good choice for users who need a text-based tool.
Using Cloud Architecture Diagrams for Decision-Making: Understanding Cloud Architecture Diagrams
Cloud architecture diagrams serve as powerful tools for supporting decision-making processes related to cloud deployment and management. They provide a comprehensive visual representation of the cloud environment, enabling stakeholders to gain insights into the various options available, optimize costs, and address security concerns.
Deployment Options
Cloud architecture diagrams help decision-makers understand the different deployment models, such as public, private, or hybrid clouds, and their respective advantages and disadvantages. By visualizing the infrastructure components, connectivity, and data flow, stakeholders can assess the suitability of each option based on their specific requirements and constraints.
Cost Optimization, Understanding Cloud Architecture Diagrams
Cloud architecture diagrams facilitate cost optimization by providing a clear understanding of resource allocation and consumption. By analyzing the diagram, decision-makers can identify areas where costs can be reduced, such as by optimizing compute instance sizes, utilizing cost-effective storage options, or leveraging spot instances.
Security Considerations
Cloud architecture diagrams play a crucial role in ensuring security by visualizing the security controls and mechanisms implemented within the cloud environment. Stakeholders can assess the effectiveness of security measures, identify potential vulnerabilities, and design mitigation strategies to protect against cyber threats.
Sharing and Collaborating on Cloud Architecture Diagrams
Effective collaboration on cloud architecture diagrams is crucial for successful cloud implementations. Here are key methods:
Version Control
Establish a central repository using tools like Git or Subversion to manage diagram versions. This ensures all stakeholders have access to the latest updates, reducing errors and miscommunication.
Documentation
Create comprehensive documentation that explains the purpose, assumptions, and constraints of each diagram. This aids understanding and facilitates effective feedback.
Feedback Mechanisms
Implement feedback mechanisms, such as code review tools or dedicated collaboration platforms, to gather input and suggestions from team members. This ensures diverse perspectives and improves diagram quality.
Common Challenges in Understanding Cloud Architecture Diagrams

Understanding cloud architecture diagrams can be challenging due to their complexity and technical nature. Here are some common challenges faced:
Lack of Context: Diagrams often lack context, making it difficult to understand the overall architecture and its purpose. This can lead to confusion and misinterpretations.
Solutions:
- Provide clear documentation and annotations that explain the purpose, scope, and key components of the architecture.
- Create diagrams that are specific to a particular use case or scenario, providing relevant context.
Overwhelming Complexity:
Cloud architecture diagrams can be complex, with numerous components and interconnections. This complexity can make it difficult to comprehend the overall flow and relationships between components.
Solutions:
- Break down diagrams into smaller, manageable chunks, focusing on specific aspects or subsystems.
- Use clear and concise symbols and notations to represent components and connections.
Lack of Standardization:
There is no universal standard for cloud architecture diagrams, leading to inconsistencies in symbols, notations, and conventions. This can make it difficult to compare and interpret diagrams from different sources.
Solutions:
- Adopt industry-recognized standards, such as the AWS Architecture Framework or Azure Architecture Diagrams.
- Establish clear guidelines and conventions within the organization to ensure consistency in diagram creation.
Case Studies of Successful Cloud Architecture Diagram Implementation
Successful implementations of cloud architecture diagrams have been instrumental in enhancing IT operations, optimizing resource allocation, and fostering collaboration within organizations. Here are some notable case studies:
AWS Case Study: Netflix
- Netflix, a global streaming giant, leveraged AWS architecture diagrams to visualize its complex infrastructure, consisting of microservices, databases, and content delivery networks.
- By creating comprehensive diagrams, Netflix engineers gained a holistic understanding of their system, enabling them to identify and resolve performance bottlenecks.
- The diagrams also facilitated collaboration between teams, as they provided a common visual representation of the system’s architecture.
Azure Case Study: Microsoft
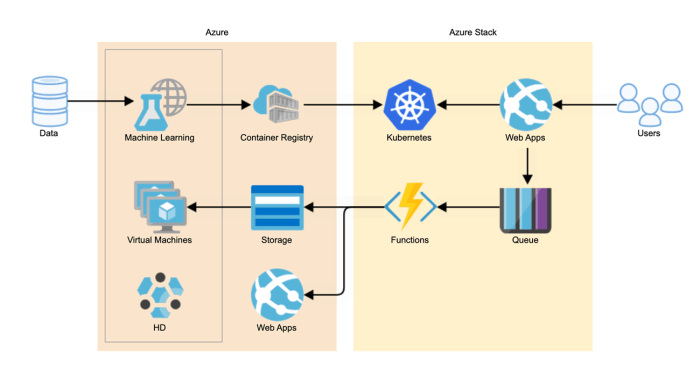
- Microsoft employed Azure architecture diagrams to design and implement its Azure Stack Hybrid Cloud solution, enabling customers to seamlessly integrate Azure services with their on-premises infrastructure.
- The diagrams served as a blueprint for the solution’s architecture, ensuring alignment between design and implementation phases.
- By utilizing the diagrams, Microsoft engineers could identify potential issues early on, reducing the risk of costly rework and delays.
GCP Case Study: SAP
- SAP, a leading enterprise software provider, adopted GCP architecture diagrams to migrate its on-premises SAP HANA database to the cloud.
- The diagrams helped SAP architects visualize the new cloud architecture and identify potential challenges, such as network latency and data security.
- By leveraging the diagrams, SAP successfully migrated its database to GCP, resulting in improved performance and scalability.
These case studies demonstrate the value of cloud architecture diagrams in successful cloud implementations. They provide a visual representation of the system’s architecture, facilitating understanding, collaboration, and decision-making.
Emerging Trends in Cloud Architecture Diagrams
Cloud architecture diagrams are continuously evolving to meet the demands of modern cloud computing environments. Emerging trends and advancements in this field include:
The adoption of artificial intelligence (AI) and machine learning (ML) is transforming the way cloud architecture diagrams are created and analyzed. AI-powered tools can automate the process of diagram creation, identify patterns and relationships, and provide insights for optimization.
Real-Time Visualization
Cloud architecture diagrams are becoming increasingly dynamic, providing real-time insights into the performance and behavior of cloud environments. This enables architects and engineers to monitor and adjust their designs on the fly, ensuring optimal performance and reliability.
Collaboration and Sharing
Cloud architecture diagrams are now more collaborative than ever, with tools that allow multiple stakeholders to work together on the same diagram. This facilitates knowledge sharing, improves communication, and ensures alignment among team members.
Last Recap

In conclusion, understanding cloud architecture diagrams is crucial for effectively designing, deploying, and managing cloud-based systems. By leveraging these diagrams, stakeholders can gain a clear understanding of the system’s architecture, identify potential issues, and make informed decisions that optimize performance, security, and cost-effectiveness.