Creating Cloud Architecture Diagrams: A Comprehensive Guide provides a detailed exploration of the art and science behind crafting effective cloud architecture diagrams. This guide will empower you with the knowledge and skills necessary to create clear, concise, and informative diagrams that accurately represent your cloud infrastructure.
As businesses increasingly adopt cloud computing, the need for well-designed cloud architecture diagrams has become paramount. These diagrams serve as visual representations of your cloud infrastructure, helping stakeholders understand the complexities of your cloud environment and make informed decisions about its design and management.
Introduction
Cloud architecture diagrams are visual representations of the components and relationships within a cloud computing system. They help architects and engineers design, plan, and manage cloud infrastructure and applications. These diagrams provide a high-level overview of the system, making it easier to understand the flow of data and processes.
Cloud architecture diagrams are essential for effective cloud management. They help identify potential bottlenecks, optimize resource allocation, and ensure that the system meets performance and security requirements.
Creating Cloud Architecture Diagrams requires a thorough understanding of cloud architecture concepts. For a deeper dive into this topic, we recommend exploring Understanding Cloud Architecture Diagrams . This article provides valuable insights into the various components and relationships within cloud architectures.
By grasping these concepts, you’ll be better equipped to create comprehensive and effective Cloud Architecture Diagrams.
Benefits of Using Cloud Architecture Diagrams
- Improved communication and collaboration: Diagrams provide a common language for stakeholders to discuss and understand the system.
- Enhanced decision-making: Visual representations help architects and engineers make informed decisions about the design and implementation of the cloud system.
- Reduced complexity: Diagrams simplify complex systems, making them easier to understand and manage.
- Increased efficiency: Diagrams help identify and eliminate inefficiencies in the system, leading to improved performance and cost savings.
- Enhanced security: Diagrams help identify potential security vulnerabilities and mitigate risks.
Types of Cloud Architecture Diagrams
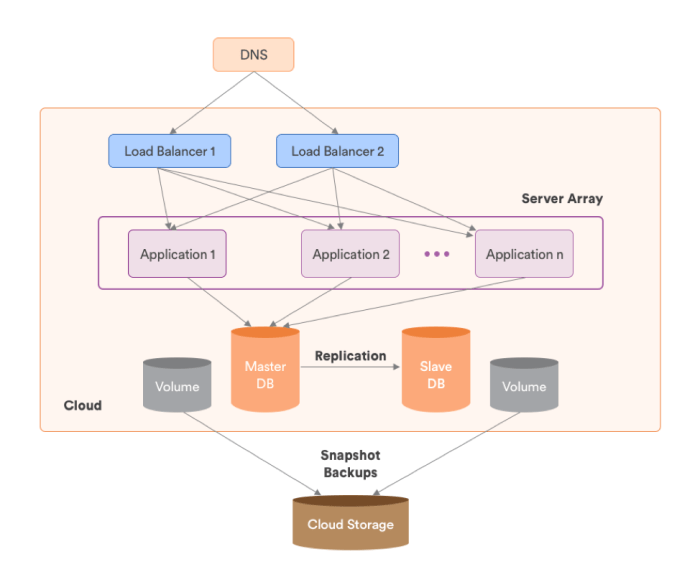
Cloud architecture diagrams are crucial for visualizing and communicating the design and implementation of cloud computing solutions. There are various types of cloud architecture diagrams, each serving a specific purpose.
Logical Diagrams
Logical diagrams depict the high-level architecture of a cloud system, focusing on the functional components and their relationships. They illustrate the overall structure and flow of data, without delving into the physical infrastructure or deployment details.
- Example:A logical diagram of a cloud-based e-commerce platform, showing the interaction between the web application, database, and payment gateway.
- Use Case:Understanding the functional components and their relationships in a cloud system, enabling stakeholders to align on the overall design.
Physical Diagrams
Physical diagrams provide a detailed view of the physical infrastructure and resources used in a cloud system. They depict the physical components, such as servers, storage devices, and network connections, and their physical arrangement.
- Example:A physical diagram of a cloud data center, showing the layout of servers, racks, and cooling systems.
- Use Case:Planning and managing the physical infrastructure, ensuring optimal performance and resource utilization.
Deployment Diagrams
Deployment diagrams illustrate the actual deployment of a cloud system, showing the specific cloud services, regions, and availability zones used. They provide a detailed view of the cloud resources and their configuration.
- Example:A deployment diagram of a cloud-based application, showing the deployment of the application across multiple regions and availability zones for high availability.
- Use Case:Understanding the deployment details and ensuring the system meets performance, availability, and scalability requirements.
Tools for Creating Cloud Architecture Diagrams
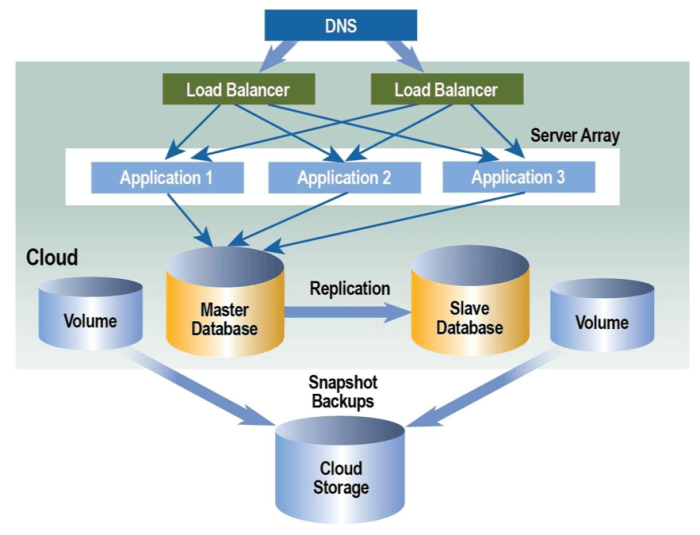
Crafting cloud architecture diagrams requires the right tools to translate complex concepts into visual representations. Here’s a selection of popular tools that empower you to create effective diagrams, both online and offline.
Online Tools
Online tools offer the convenience of accessibility from any device with an internet connection. They typically provide a user-friendly interface and a range of templates to expedite the diagram creation process.
- Lucidchart:A comprehensive online diagramming tool with a vast library of templates and shapes specifically designed for cloud architecture diagrams.
- Draw.io:A free and open-source online diagramming tool that supports cloud architecture shapes and offers real-time collaboration features.
- Gliffy:An online diagramming tool with a focus on cloud computing and network diagrams, providing pre-built cloud architecture templates.
Offline Tools
Offline tools offer the advantage of working without an internet connection and provide more advanced features for complex diagram creation.
- Microsoft Visio:A widely used diagramming software with a comprehensive set of shapes and templates for cloud architecture diagrams.
- OmniGraffle:A Mac-based diagramming tool known for its intuitive interface and support for custom stencils, making it ideal for creating specialized cloud architecture diagrams.
- yEd Graph Editor:A free and open-source diagramming tool that offers advanced features such as automatic layout algorithms and support for large diagrams.
Best Practices for Creating Cloud Architecture Diagrams
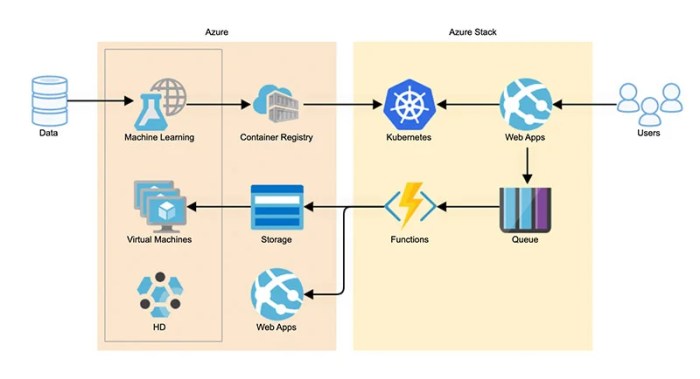
To ensure clarity and effectiveness in cloud architecture diagrams, it’s crucial to establish best practices. These guidelines provide a framework for creating diagrams that accurately represent the architecture, simplify understanding, and facilitate collaboration.
Best practices encompass aspects such as layout, symbols, and annotations, ensuring that diagrams are well-organized, visually appealing, and convey information concisely.
Layout
A well-structured layout enhances the readability and comprehension of diagrams. Consider the following guidelines:
- Logical flow:Arrange components in a logical sequence, following the flow of data or processes.
- Whitespace:Use whitespace effectively to separate components and create visual hierarchy.
- Grouping:Group related components together to improve clarity and organization.
- Color-coding:Use colors to differentiate components or layers of the architecture.
Symbols
Standardized symbols ensure consistency and ease of understanding. Consider using:
- Common industry standards:Adhere to established symbols from organizations like AWS, Azure, or Google Cloud.
- Custom symbols:Create custom symbols for unique or specific components, ensuring they are well-defined and documented.
- Consistent usage:Use symbols consistently throughout the diagram to avoid confusion.
Annotations
Annotations provide additional context and clarity. Consider including:
- Component descriptions:Briefly describe the purpose and functionality of each component.
- Data flow:Indicate the direction and flow of data between components.
- Assumptions and constraints:Note any assumptions or constraints that impact the architecture.
- Version control:Include version information to track changes and updates.
Components of a Cloud Architecture Diagram
Cloud architecture diagrams are visual representations of the components and relationships within a cloud computing environment. These diagrams can help stakeholders understand the architecture of a cloud system, identify potential bottlenecks, and plan for future growth. The essential components of a cloud architecture diagram include:
- Cloud services: These are the services that are offered by a cloud provider, such as compute, storage, and networking.
- Infrastructure: This is the physical infrastructure that supports the cloud services, such as servers, storage devices, and network equipment.
- Network connectivity: This is the network infrastructure that connects the cloud services and infrastructure to each other and to the outside world.
These components can be represented in a diagram using a variety of shapes and symbols. For example, cloud services can be represented by rectangles, infrastructure can be represented by circles, and network connectivity can be represented by lines. The diagram should also include labels that identify the components and their relationships to each other.
Documenting Cloud Architecture Diagrams
Documenting cloud architecture diagrams is a critical step in ensuring that the diagrams are useful and can be easily understood by others. Well-documented diagrams can help to improve communication between team members, facilitate knowledge transfer, and ensure that the diagrams remain up-to-date as the cloud architecture evolves.
Here are some tips for creating documentation that is clear, concise, and up-to-date:
- Use a consistent style and format for all documentation.
- Include a brief overview of the cloud architecture diagram, including its purpose and scope.
- Describe the components of the diagram in detail, including their relationships to each other.
- Use clear and concise language.
- Include screenshots or other visuals to help illustrate the diagram.
- Keep the documentation up-to-date as the cloud architecture evolves.
Version Control
It is important to version control cloud architecture diagrams so that you can track changes over time. This will help you to identify and resolve any issues that may arise, and it will also make it easier to collaborate with others on the diagrams.
There are a number of different version control systems that you can use, such as Git or Subversion. Once you have chosen a version control system, you will need to create a repository for your cloud architecture diagrams. You can then add the diagrams to the repository and track changes over time.
Collaboration
Cloud architecture diagrams are often created by multiple people, so it is important to have a way to collaborate on them. Version control can help with this, as it allows multiple people to work on the same diagram at the same time.
However, it is also important to have a way to communicate with each other about the changes that are being made.
There are a number of different tools that you can use to collaborate on cloud architecture diagrams, such as wikis or chat rooms. These tools can help you to share ideas, discuss changes, and resolve conflicts.
Collaboration on Cloud Architecture Diagrams
Collaboration is essential for creating comprehensive and effective cloud architecture diagrams. By involving multiple stakeholders, including architects, developers, and business leaders, diverse perspectives and expertise can be incorporated into the design process, resulting in more robust and well-rounded diagrams.
Effective collaboration requires the use of shared workspaces and version control systems. Shared workspaces allow multiple users to access and edit diagrams simultaneously, enabling real-time collaboration and feedback. Version control systems, such as Git, help track changes to diagrams over time, allowing for easy rollback and recovery in case of errors.
Strategies for Effective Collaboration
- Establish clear roles and responsibilities for each stakeholder involved in the collaboration process.
- Use a shared workspace to facilitate real-time collaboration and feedback.
- Implement a version control system to track changes and enable easy rollback and recovery.
- Hold regular meetings or discussions to discuss diagram updates, changes, and feedback.
- Encourage open communication and feedback to foster a collaborative environment.
Advanced Techniques for Cloud Architecture Diagrams
Cloud architecture diagrams can become complex when they need to convey a large amount of information. Advanced techniques can help to simplify these diagrams and make them easier to understand.
Hierarchical Structures
Hierarchical structures can be used to organize cloud architecture diagrams into a tree-like structure. This can make it easier to see the relationships between different components of the architecture. For example, a hierarchical diagram could show the different layers of a cloud architecture, such as the infrastructure layer, the platform layer, and the application layer.
Layered Diagrams
Layered diagrams can be used to show the different layers of a cloud architecture. This can help to make it easier to see how the different components of the architecture interact with each other. For example, a layered diagram could show the different layers of a cloud storage system, such as the storage layer, the network layer, and the application layer.These
are just a few of the advanced techniques that can be used to create cloud architecture diagrams. By using these techniques, you can create diagrams that are clear, concise, and easy to understand.
Case Studies of Cloud Architecture Diagrams
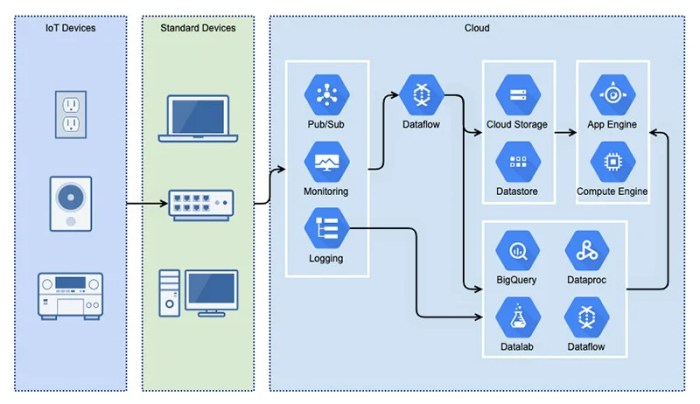
Real-world examples of effective cloud architecture diagrams can provide valuable insights into the best practices and techniques used by successful organizations. Analyzing these diagrams allows us to understand the strengths and weaknesses of different approaches, enabling us to create more effective diagrams for our own projects.
One notable case study is the cloud architecture diagram developed by Netflix. This diagram provides a comprehensive overview of Netflix’s complex cloud infrastructure, including the various components and services used to deliver its streaming content to millions of users worldwide.
The diagram is highly detailed and well-organized, making it easy to understand the relationships between the different components and how they work together.
Strengths, Creating Cloud Architecture Diagrams
- Comprehensiveness:The diagram covers all aspects of Netflix’s cloud infrastructure, providing a complete picture of the system.
- Clarity:The diagram is well-organized and easy to understand, with clear labels and descriptions for each component.
- Detail:The diagram includes a high level of detail, showing the relationships between different components and how they interact.
Weaknesses
- Complexity:The diagram is quite complex, which can make it difficult to understand for non-technical audiences.
- Lack of context:The diagram does not provide much context about the business goals or requirements that drove the design of the infrastructure.
- Outdated:Cloud architectures are constantly evolving, so it’s important to note that this diagram may not reflect the latest changes in Netflix’s infrastructure.
Future Trends in Cloud Architecture Diagrams
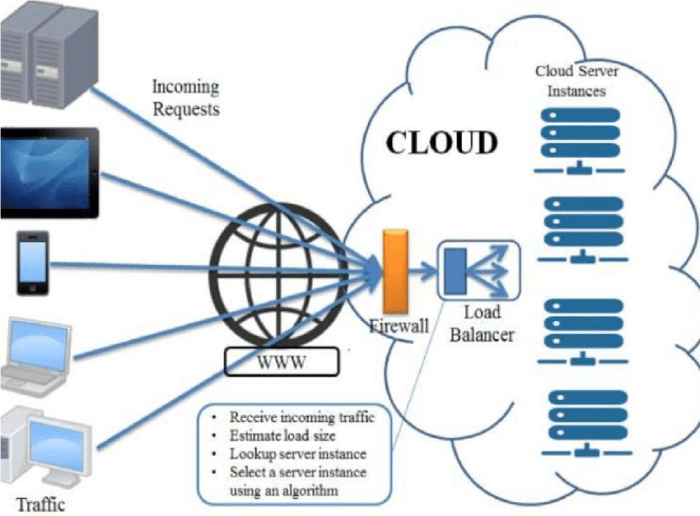
The future of cloud architecture diagramming is bright, with many emerging trends that will shape how we design and document cloud architectures.
One of the most significant trends is the use of artificial intelligence (AI) and machine learning (ML). AI and ML can be used to automate many of the tasks involved in creating cloud architecture diagrams, such as generating diagrams from code or analyzing diagrams for errors.
AI and ML in Cloud Architecture Diagrams
- Automated diagram generation: AI and ML can be used to generate cloud architecture diagrams from code or other artifacts. This can save a significant amount of time and effort, and it can also help to ensure that diagrams are accurate and consistent.
- Diagram analysis: AI and ML can be used to analyze cloud architecture diagrams for errors or inconsistencies. This can help to identify potential problems early on, before they can cause issues in production.
- Recommendation engines: AI and ML can be used to provide recommendations on how to improve cloud architecture diagrams. This can help architects to make better decisions about the design of their cloud architectures.
Another trend is the increasing use of cloud-native tools for creating cloud architecture diagrams. Cloud-native tools are designed specifically for working with cloud architectures, and they can provide a number of benefits, such as:
Cloud-Native Tools for Cloud Architecture Diagrams
- Integration with cloud platforms: Cloud-native tools can be integrated with cloud platforms, such as AWS, Azure, and GCP. This allows architects to access cloud-specific data and services, which can make it easier to create accurate and detailed diagrams.
- Support for multiple cloud platforms: Cloud-native tools typically support multiple cloud platforms. This allows architects to create diagrams for any cloud environment, regardless of the platform they are using.
- Collaboration features: Cloud-native tools often include collaboration features, such as version control and commenting. This makes it easier for architects to work together on diagrams and share their work with others.
Finally, we are also seeing a trend towards the use of more visual and interactive cloud architecture diagrams. These diagrams can help to make cloud architectures more understandable and accessible to a wider audience.
Visual and Interactive Cloud Architecture Diagrams
- 3D diagrams: 3D diagrams can be used to create more realistic and immersive representations of cloud architectures. This can help to make diagrams more understandable and easier to navigate.
- Interactive diagrams: Interactive diagrams allow users to explore and interact with diagrams. This can help to make diagrams more engaging and informative.
- Data visualization: Data visualization techniques can be used to create diagrams that are more visually appealing and easier to understand. This can help to communicate complex information in a clear and concise way.
These are just a few of the trends that are shaping the future of cloud architecture diagramming. As the cloud continues to evolve, we can expect to see even more innovative and powerful tools and techniques emerge.
Conclusion
In conclusion, cloud architecture diagrams play a crucial role in visualizing and communicating complex cloud architectures. They enable stakeholders to understand the structure, components, and interconnections of cloud systems. By leveraging the insights gained from these diagrams, organizations can optimize their cloud deployments, improve collaboration, and make informed decisions.
As cloud adoption continues to grow, the significance of cloud architecture diagrams will only increase.We encourage readers to embrace the use of cloud architecture diagrams as a valuable tool for effective cloud management. By understanding the types, tools, and best practices associated with these diagrams, organizations can harness their full potential to enhance cloud architecture design, collaboration, and documentation.
Final Wrap-Up
In conclusion, creating effective cloud architecture diagrams is a critical skill for anyone involved in cloud computing. By following the best practices Artikeld in this guide, you can create diagrams that are clear, concise, and informative. These diagrams will help you communicate your cloud architecture effectively, make informed decisions about your cloud environment, and ensure the success of your cloud initiatives.